With the world of fine wine descending on Bordeaux to taste the latest vintage in April, here's my report on how the weather in 2022 shaped the wines. It will serve as a backdrop as to why the wines taste the way they do – even at this early stage, of course, for the reds – and to put 2022 in context by comparing the conditions with those of recent years.

If you're short of time, or don't need to see my somewhat detailed analysis, then suffice to say that it was both hot and dry during the Bordeaux growing season in 2022. It was a year of highs and lows – high temperatures, low rainfall.
What was pretty remarkable is that the vines, not least in the better-placed vineyards, held up incredibly well despite the ongoing drought and protracted summer heatwaves.
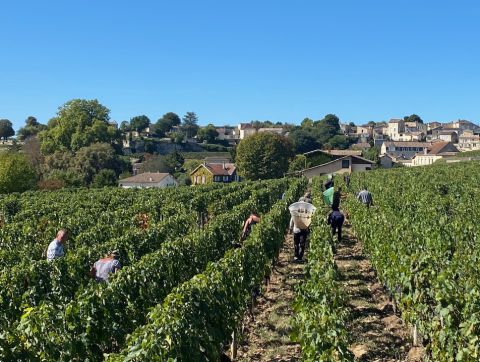
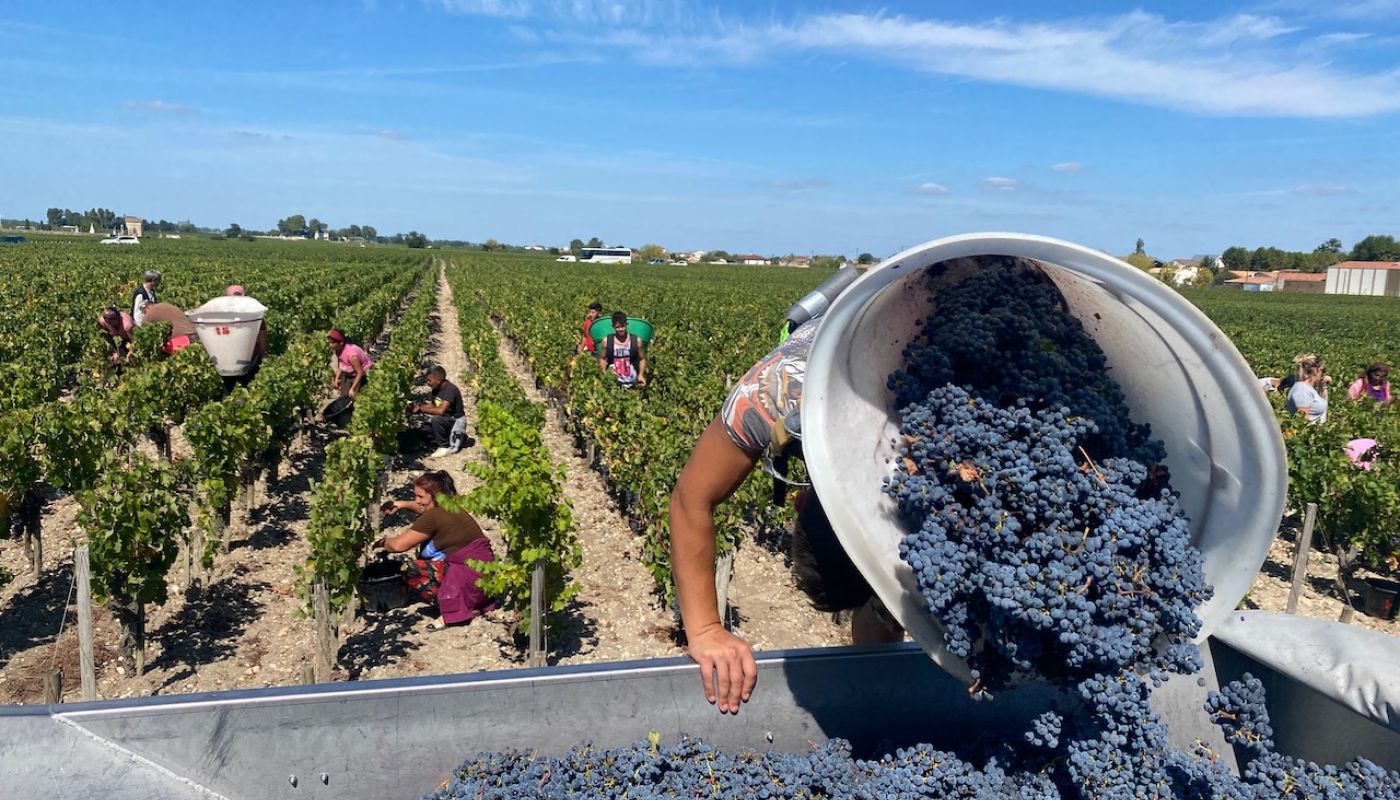
The vast majority of the red grapes for Bordeaux 2022 were harvested in September, much like in 2018 and 2020. (In many other great years, such as in 2010, 2016 and 2019, the red harvest stretched well into October.)
Bordeaux 2022 growing season

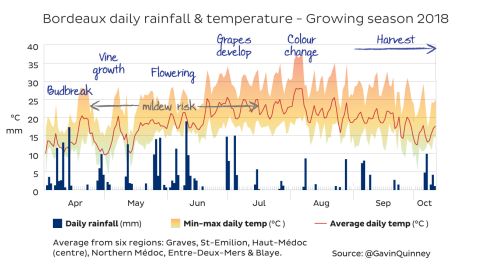
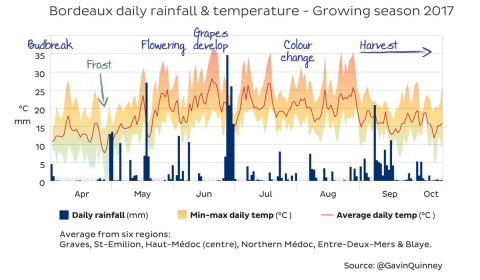
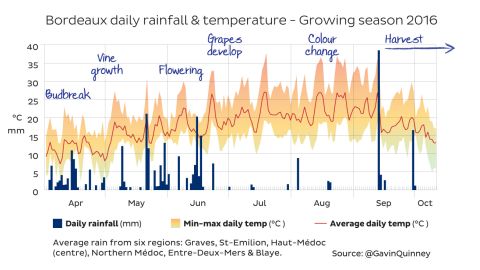
This is a chart I've put together each year since the 2016 vintage, taking the data from six subregions of Bordeaux to get a more representative picture of the vintage. You can see how the vintages compare at the foot of this piece.
I've included March and October for 2022, though the 'visible' six months of the growing season were from April to September. Budbreak kicked off before the frosts of 2–5 April, which had an impact on some vineyards. (Comparatively few vineyards profited from the warm October at the end of the season, as their harvests were completed before then, though this would have been ideal for any late-picked sweet whites.)
There were numerous heatwaves and prolonged periods of drought in 2022.
It was certainly warm from the very start of the flowering onwards, through to the end of the harvest for most growers. In the 20 weeks from 7 May to 23 September, 117 days (the equivalent of almost 17/20 weeks) saw daytime temperatures reach 24 °C (74 °F) or more on average across the region, compared with 23 days which failed to reach 24 °C, and some only just. 72 of those 140 days – more than half – registered 28 °C (82 °F) or more, and 38 days registered 32 °C (90 °F) plus. Those were very warm days. Thankfully for us and the vines, the nights often remained relatively fresh.
Much of the rain in June came from storms following a crazy heatwave around the weekend of 18 June, when many record temperatures of 40 °C (104 °F) or more were set in various places around Aquitaine. Cap Ferret on the coast registered 41.9 °C on 18 June, beating the previous record there of 40.6 °C set in August 2003. (18 June? That's weeks before the summer holidays even begin.)

The amount of rain can vary dramatically from one region to another, especially as a result of storms – including hail – following a heatwave. The average may show 94 mm (3.7 in) for the month of June, but St-Émilion had 69 mm, Blaignan in the north of the Médoc 158 mm (6.2 in) for the month, Pauillac 134 mm, Margaux 82 mm, Bourg 120 mm, Podensac in the Graves 64 mm (only 2.5 in) and our local station registered 72 mm.
While the storms of the week of 20 June were potentially disastrous for many of the vineyards that were hit by hail, the heavy rain was a godsend for the many more across the region that were spared. There had been a distinct lack of water since the start of the year and we were about to go through a period of drought coupled with further heatwaves.
I put the chart above together because it's a useful guide to the flow of the growing season, based on weekly rain and temperature stats, as well as displaying how each month compares with the 30-year average for rain and temperature.
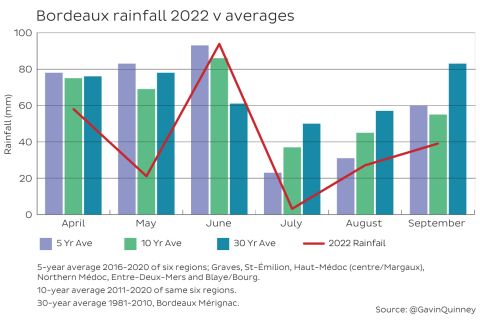
Rainfall – comparing 2022 with recent vintages
Here I dive into how the amount of rain compares with other years.
Each year the table gets a little bigger but I've kept 2009 and 2010 in because they were excellent vintages for Bordeaux and many of the top reds are, arguably, just entering their window of drinkability.
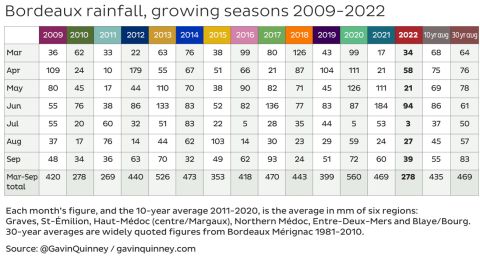
2022 was undoubtedly one of the drier years and, using my data from six weather stations (other similar grids would contain different statistics), the total rainfall from March to September is similar to that of another dry year, 2010. (The temperatures were quite different however, and more on that in a moment.)
Note, for example, how the recent excellent 'even' years of 2016, 2018 and 2020 had dry summers, as did 2022. One main difference with 2022 and those vintages is that we didn't have much water in the spring.
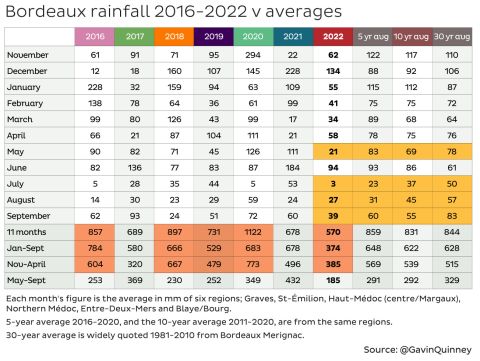
The amount of rain during the growing season is important. We growers look at the forecast every day, if not several times a day, and most weeks we're muttering that we've not had enough or that we've had too much. Statistically, it's useful as well to look at what happened before the vineyard sprung into life in late March and April, which is why I've added this table. (We're getting pretty geeky here but you see the point.)
Thankfully we had some decent rain in December 2021, because from then on it was comparatively really dry. I've added here a five-year average from 2016–2020 as well as the 10-year and 30-year averages. By every measure 2022 was drier than the lot.
In the coloured boxes towards the bottom of the table I've highlighted how the recent excellent years of 2016, 2018, 2019 and 2020 compare with 2022. From the start of the year to the end of the harvest it was far drier in 2022.
The numbers are quite interesting. For example, the rainfall figures from May to September aren't so very far removed from, say, 2016 and 2018, and 2022 is being widely compared to 2020 – both years having dry summers that we can remember, and the timing and evolution in the vineyard was similar. Yet 2020 had a much wetter start, with double the rainfall of 2022 in the 11 months from November to the end of the red harvest in September.
For the figures on the right of the table in yellow, I've highlighted how 2022 was drier than the averages for the crucial months of May, July and September. But it's also quite revealing how July and August appear to be getting drier (looking at the 5-, 10- and 30-year averages) but that's not the case from January to June (other than for 2022).
One simple reason the amount of rain is so significant, especially when it's hot, is that irrigation is not permitted. (Excluding, in 2022, the derogation from the INAO that the growers in Pomerol were granted, which allowed them to water their vines under strict conditions – albeit fairly late on.) Our vines are at the mercy of the weather, with drought and heat being two of the main things that they have to contend with in a year like this. That's why these statistics can, I'd argue, be fairly instructive.
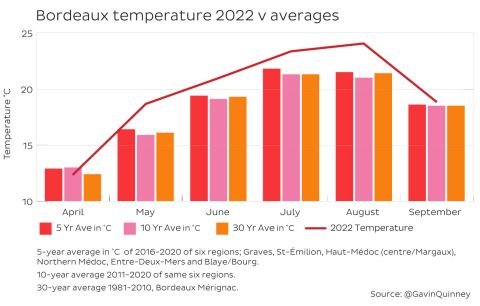
Temperatures – comparing 2022 with recent vintages

Just as we had low levels of rain for each month, other than the storm-hit June, we saw higher temperatures each month since at least 2009 for May, June, July and August. The gap with the same months in 2021 is huge, September apart, and it's interesting to compare 2022 with the average temperatures.
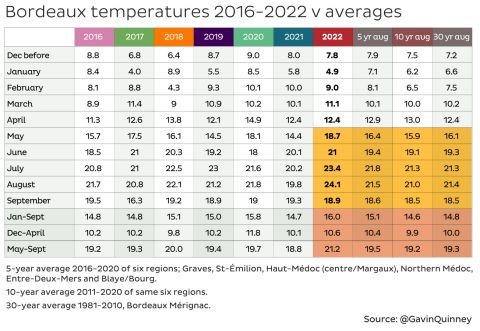
Here again I've pulled out the figures for the year for the last few vintages. (All but 2017 and 2021 here are considered excellent years.) We did have a usefully cold spell in January 2022, which helped give the vines a winter break.
The averages overall from May to September – see the bottom row – were significantly higher in 2022, and particularly in both July and August.
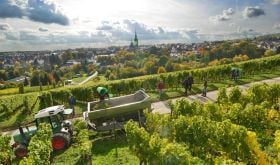
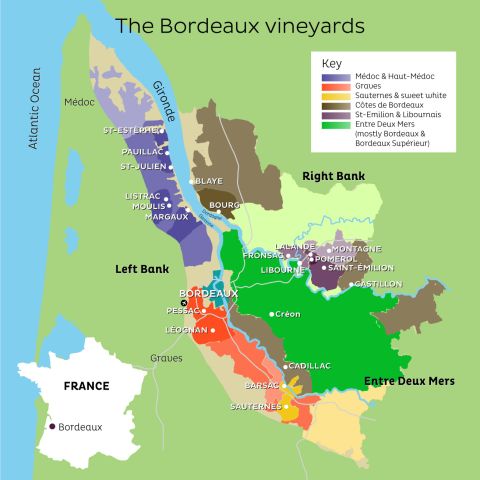
The vineyards of Bordeaux
For many years now, I've taken the rainfall and temperature figures from six weather stations in the same subregions of Bordeaux each year, or adjacent ones if some data aren't available from time to time. I used to find that when individual appellations and weather stations were quoted they didn't really reflect Bordeaux as a whole – especially with rainfall. Bordeaux Mérignac, on the outskirts to the west of the city with the airport of the same name, is generally the most widely quoted source for weather data.
Bordeaux wine production 2006–2022
Bordeaux produced 410 million litres of wine in 2022 (108 million gallons), and, although this was more than in 2013, 2017 and 2021, this was a relatively small crop. It is the equivalent of almost 550 million bottles, with a modest yield of around 37 hl/ha (roughly 2 ton/acre).

Bordeaux 2022 harvest may be up 9% on 2021's 377 million litres, and sits neatly in between that and 2020's 440 million litres. However, 2022 was down more than 15% on the 10-year average from 2011–2020 of 487 million litres (equivalent to 650 million bottles).
That 2011–2020 decade included three smaller crops in 2013, 2017 and, to a lesser extent, 2020. In the noughties, the average annual production from 2001 to 2010 was over 580 million litres, equivalent to over 770 million bottles – over 40% more annually on average than for 2022.
Around 85% was red, 5% rosé, 9% dry white and just 1% sweet white in 2022. More details are not available as of the end of March 2023, as customs (to whom all producers submit their harvest declarations) have apparently had some issues after a recent software upgrade. Details on yields and production for the 60 or so Bordeaux appellations are normally released by mid February.
Here are the 5-year production averages for Bordeaux since 1986:
1986–1990 – 536 million litres
1991–1995 – 537 million litres
1996–2000 – 666 million litres
2001–2005 – 604 million litres
2006–2010 – 557 million litres
2011–2015 – 502 million litres
2016–2020 – 470 million litres
2021–2022 – 393 million litres so far
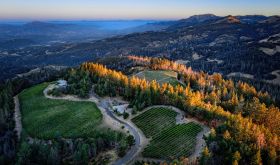
Hail in Bordeaux, 20 June 2022
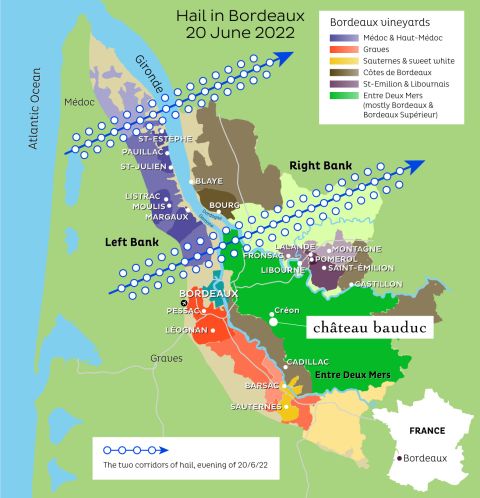
A report on the weather for Bordeaux 2022 wouldn't be complete without a mention of the hailstorms on 20 June. Hundreds of vineyards were affected on both the left and right banks of the Gironde estuary.
As is often the case after a 40 °C heatwave (18 June), hailstorms were forecast for the night of Monday 20 June. Two corridors of hail swept through the Bordeaux region and, as ever, the impact of hail on vineyards was localised, with the damage variable from one area to the next. As we know ourselves from May 2009 and August 2013, sometimes your luck just isn't in. This time we were more fortunate but you always feel for those that have been hit.
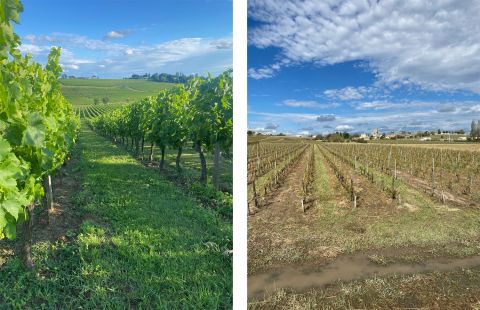
On the left is a vineyard near Bourg on 23 June, and on the right a vineyard at St-Gervais a few kilometres away on the road from St-André-de-Cubzac to Bourg, which runs close to the Dordogne River at the point where it merges with the Garonne to form the Gironde estuary.
Appendix – the growing seasons from 2021 back to 2016
What sets 2022 apart are the temperatures from mid June through to mid September.


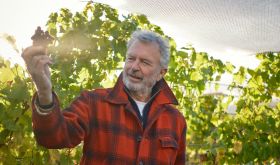
All images kindly provided by Gavin Quinney.