Here is my detailed report on the amount of wine produced by the whole of Bordeaux in 2020. Each year I pull together the latest figures after they are released in February, and update my tables, charts and maps before the en primeur tastings of the new vintage in the spring.
Regular readers will be delighted that I’ve added some new, thrilling graphics for 2021, so this deep-dive analysis has now sunk even lower: if the wines of Bordeaux and/or data crunching aren’t really your thing, you may want to scroll swiftly along.
This review of how much wine was made, and where, should be seen as a follow-up to my detailed 2020 harvest and weather report from last October, published soon after the crop came in. The weather and growing conditions, naturally enough, go hand in hand with the volume and quality of wine produced. ‘There’ll be some terrific wines from 2020’, I wrote. ‘Yields for many estates are lower, with less juice due to heat and drought, but the quality is high – albeit variable.’
Bordeaux 2020 production compared with previous vintages
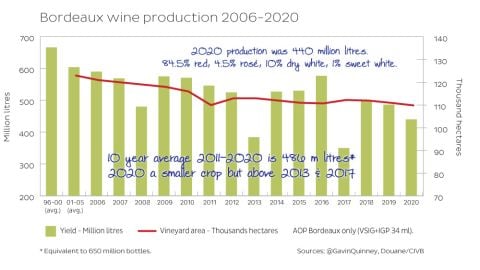
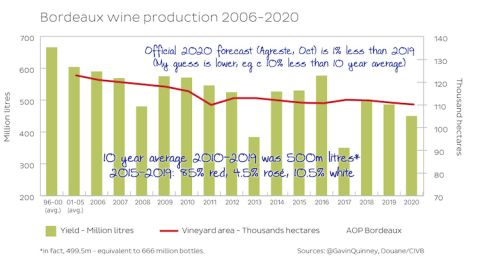
Bordeaux produced 440 million litres of wine in 2020, the equivalent of 587 million bottles. This was around 10% less than in 2019 and 2018 (486 and 499 million litres respectively), which were both close to the 10-year average.
The average for the decade 2011–2020 was 486.4 million – oddly enough, exactly the same as the production figure for 2019. So it’s fair to say that, on average, Bordeaux produces 650 million bottles per year.
The decade includes three smaller crops in 2013, 2017 and now, to a lesser extent, 2020. In the ten years prior to 2013, the average was 566 million litres, equivalent to over 750 million bottles – an average of 100 million more bottles per year.
I’ll cover the reduction in yields and production overall – and the number of growers – in more detail towards the end of this piece (there are fewer than half the number of growers today than when I came here in 1999, thereby doubling the vineyard area of those that remain, on average). See the table ‘Bordeaux production 2003–2020’ and the graph ‘Bordeaux production overview 1985–2020’ below – fascinating stuff, honestly.
Lower yields in top appellations in 2020
Ahead of the en primeur tastings in the spring – in whatever form they may take – it may be useful to note the amount of wine produced in the most sought-after appellations. Not that this should impact on how a wine might perform and be rated by critics and the trade, but there’s an obvious link to supply, demand and price.
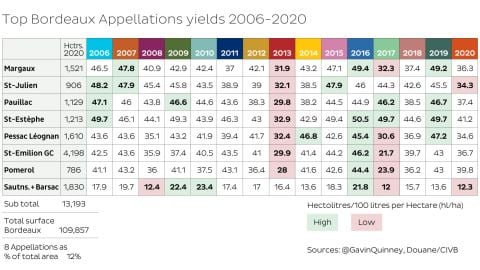
St-Julien, for example, has been on a roll for both quality and quantity for some years. The average yield for the five years from 2015 to 2019 was 45.3 hl/ha (hectolitres per hectare), whereas the yield in 2020 was 25% lower at 34 hl/ha.
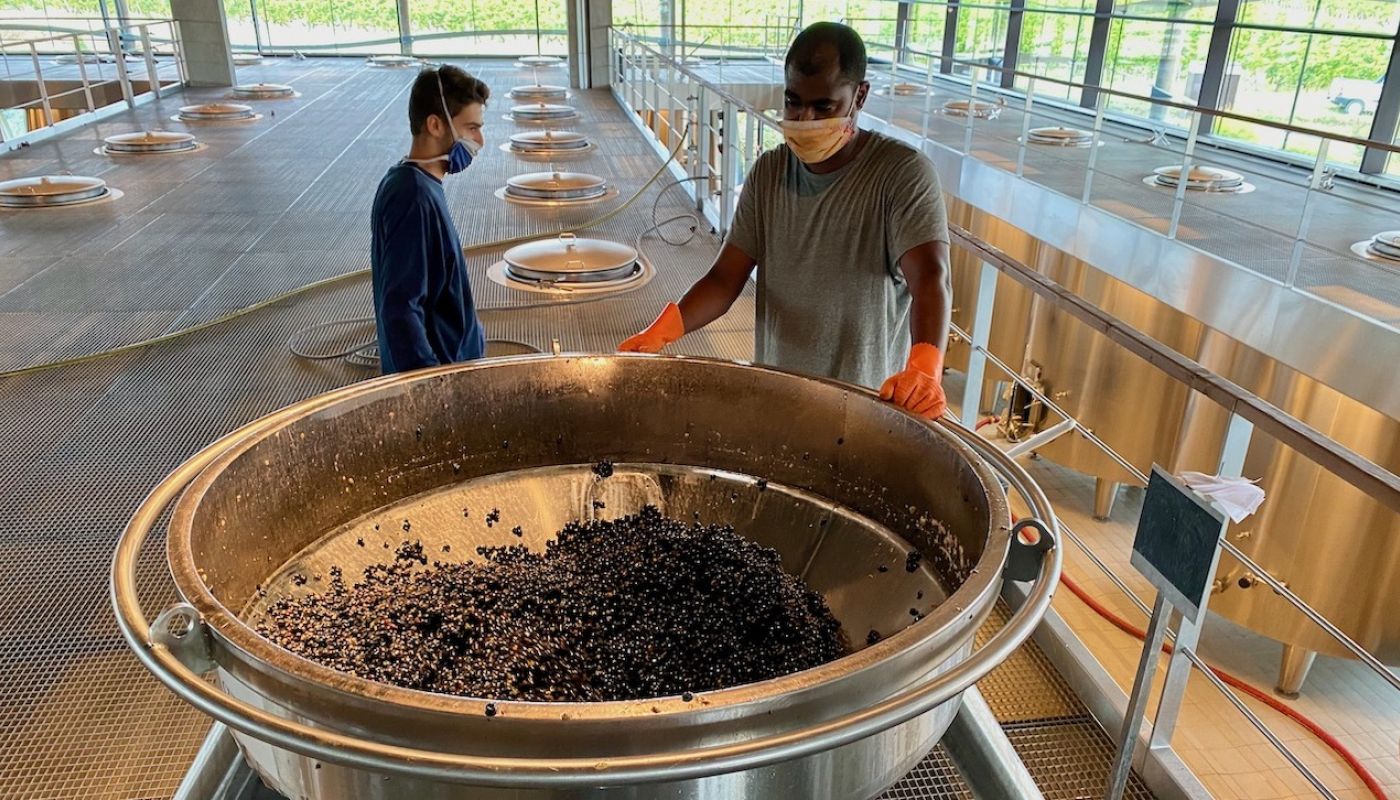
That’s not to say, of course, that all vineyards there saw low yields in 2020. Ch Beychevelle for example, pictured above and below, achieved a yield (rendement) of a little over 45 hl/ha.
The updated table shows just what a contrast there is between 2019 and 2020 in terms of volume. My production report last year was Bordeaux 2019: a fine crop at the top: ‘The 2019 vintage saw a return to good yields across the board in the seven most prestigious areas, after mixed fortunes in the two previous vintages.’
Quality in 2020 is less of an issue, in my view.
‘2020 has ended up being a really good but variable year with wines of outstanding potential for many Bordeaux estates’, I wrote last October. ‘The growing season follows a similar pattern to 2016, 2018 and 2019, in that we had a wet spring followed by a dry, hot summer, topped off by a warm, dry harvest. Unlike 2016 and 2019, it was an early vintage – not unlike 2018 in terms of timing.’
Why the lower yields in 2020?
Low yields are often a result of poor flowering and fruit set, but that wasn’t the case for most growers in 2020. It was down to a combination of factors and here are three main ones: first, the pressure of mildew early on in the growing season; second, from 18 June to 11 August, there were 54 days of drought.
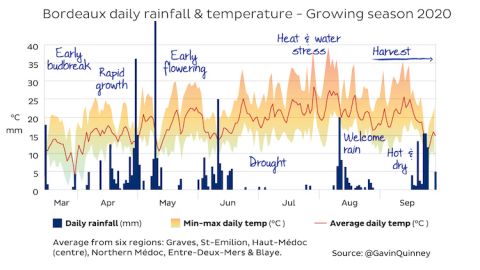
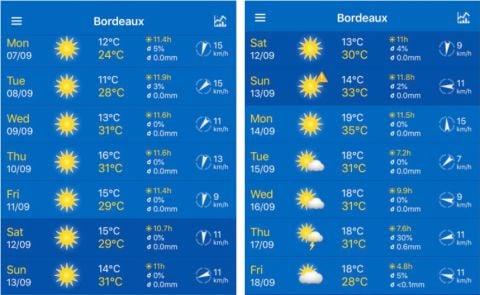
Third, and this was a peculiarity of Bordeaux in 2020, it was an early harvest and a heatwave in mid-September took its toll on the berries and the juice. Mid 30s °C (mid 90s °F) in mid September? You could almost feel the juice evaporating. Below are two of my screenshots of the forecast at the time. Almost all the red grapes were harvested that month, which is unusually early.
There was less of an impact for those with precocious vineyards, such as in Pomerol, or for the earlier-ripening dry whites.
The late heatwave and its impact may have been missed by the official forecasters in their October update. On the ground, it certainly felt as though there was going to be more than a token 1% reduction in yields from 2019. This was my production forecast from my 2020 harvest report at the time:
2020 yields across all Bordeaux appellations
Beyond the top appellations shown above, we can see that yields were lower in 2020 for all the categories for red, though not significantly for dry whites or rosé. These were less affected by the mid-September heatwave as most grapes for them had already been harvested.
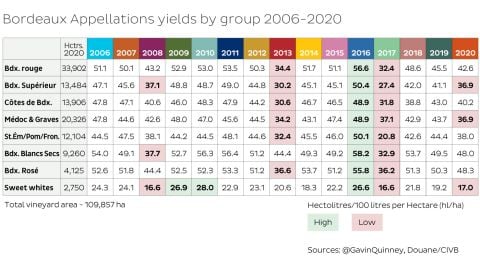
The production of Bordeaux Supérieur at 37 hl/ha is barely sustainable at current trade prices, in my view. There’s a relatively small total of 50 million litres of this in 2020 (13,484 hectares x 36.9 hl/ha).
Note that generalisations about vintage conditions can sometimes be misleading. Compare the fortunes of the St-Émilion group in 2020 versus 2017 (the year of the frost), with that of the Médoc and Graves.
I added Sauternes and Barsac to the group of top appellations, partly because their yields are lower than the general category of sweet whites (in which they’re also included).
Where all the Bordeaux wine comes from
This is a map, or one like it, that many wine drinkers may have seen from time to time. In my versions below, I’ll try to show where all the wine comes from.
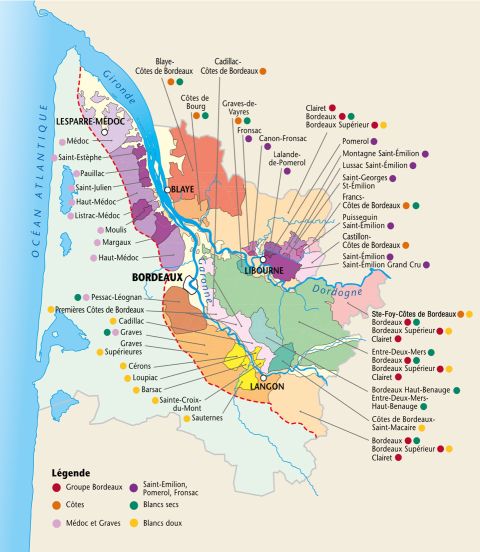
The problem with maps like this, and the appellation system in Bordeaux, is that they can give a misleading impression. Compare Ste-Foy Côtes de Bordeaux, in the east, with St-Émilion Grand Cru. Ste-Foy looks quite a lot bigger.
In 2020, 198 ha (490 acres) were declared by growers there as Ste-Foy Côtes de Bordeaux. St-Émilion Grand Cru, meanwhile, just across the river? Exactly 4,000 hectares more, with 4,198 ha (10,373 acres).
Equally, the Entre-Deux-Mers is always shown as a leafy, pastoral green. Even some people in the know think of it as a white-wine region.
Vineyard areas as a percentage of the whole
The Entre-Deux-Mers is in fact the engine room for Bordeaux Rouge and close to half of the Bordeaux vineyards, by surface area, are in the Entre-Deux-Mers. The Entre-Deux-Mers white-wine appellation, on the other hand, accounts for just 1.5% of the Bordeaux vineyard (1,655 ha/4,090 acres).
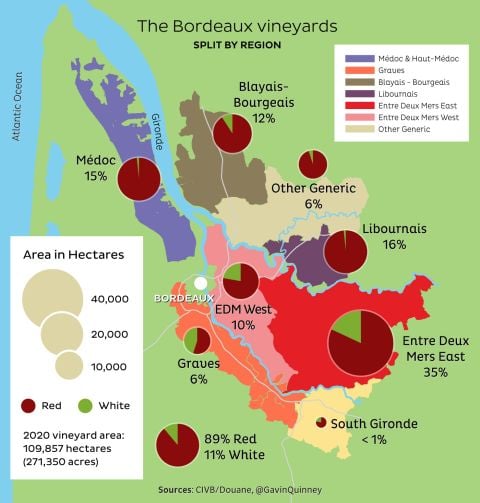
Likewise, the Médoc is both a region and an appellation.
It’s a shame that ‘Other generic’ west of the Libournais doesn’t have a better name. A lot of good Bordeaux Supérieur comes from there. Technically that area is known as the Cubzaguais but it’s unlikely to catch on. Ideas welcome ([email protected] or @gavinquinney).
As we’ve seen above, 84.5% of the wine produced in 2020 was red, 4.5% rosé, 10% dry white and 1% sweet white. Given that rosé is made from the juice of red grapes, this matches the split in the Bordeaux vineyard between red and white (89%/11%).
89% of the 109,900 ha (271,450 acres) of Bordeaux vines in production in 2020 were planted with red varieties, and 11% with white. Two-thirds of that 89% is Merlot, 22% Cabernet Sauvignon, 9% Cabernet Franc, with the last 3% split between Petit Verdot, Malbec and a tiny amount of Carmenère. The white vineyards are split between Sauvignon Blanc (including a little Sauvignon Gris) and Sémillon with 46% each, with 5% Muscadelle and others.
Yields and size per appellation across Bordeaux
To be fair, I first produced this map while I was looking into the damage caused by the spring frost in late April 2017. I’ve kept the comparisons of yields in each appellation going since then.
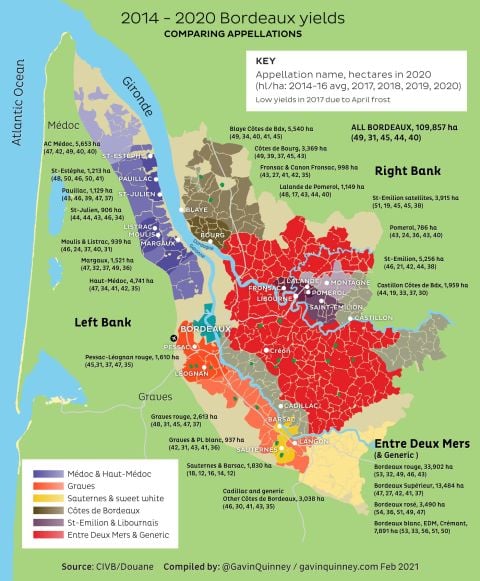
A little geeky, admittedly, but compare, say, the Médoc appellation yields over recent years, with Moulis and Listrac not far away. Note also the scale of the appellations on the right bank. And do go out and buy a bottle of Sauternes [agreed so heartily – JR] – at those yields theirs is, indeed, a labour of love.
2020 Bordeaux production by appellation group

The colours shown here match those in the map above. If you want to know how many bottles come from each area, take the figure in brackets (expressed in millions of litres) and divide by 0.75.
Annual production back to 2003
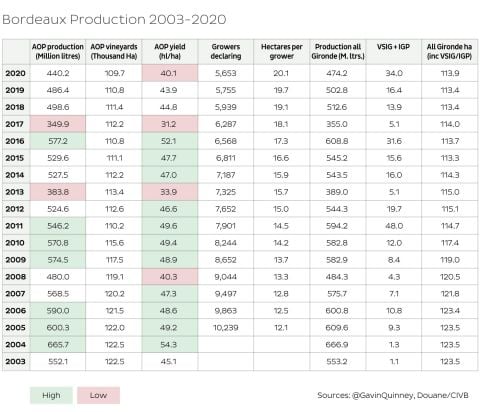
A new table for this year’s report and essentially a copy of part of a large spreadsheet I use.
The point, other than showing the production figures per year, is to demonstrate:
- How yields per hectare have come down, especially in the last four years.
- How production, 2016 apart, has fallen since the noughties.
- The reduction in the number of growers, though this almost levelled off last year (to some extent due to the impact of COVID).
- That the total Bordeaux vineyard area has remained stable for a decade.
- The grant scheme for growers to rip out vines in the 2000s had the desired effect back then.
- The increase in the surface area per grower: the number of people declaring a vintage has gone down but not the land under vine in the last ten years.
- That some growers with bigger yields than those permitted by the INAO in 2020 (as in 2011) have gone for VSIG (‘vins sans indication géographique’ or Vins de France) and IGP (‘indication géographique protégée’). 34 million litres is small by comparison with the appellation wines but is not to be sniffed at.
The rise and fall 1985–2020
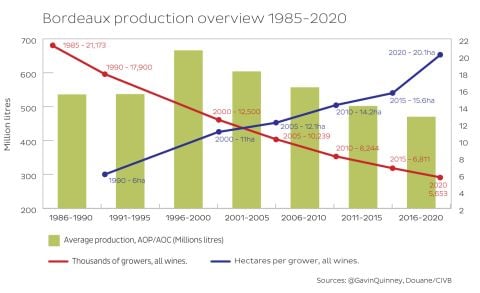
Here are the average annual production figures over each five-year period from the late 1980s to 2020.
|
Five-year period |
Average annual production (million litres) |
|
1986–1990 |
536 |
|
1991–1995 |
537 |
|
1996–2000 |
666 |
|
2001–2005 |
604 |
|
2006–2010 |
557 |
|
2011–2015 |
502 |
|
2016–2020 |
470 |
The number of Bordeaux growers completing a declaration form last year (it’s not optional) was 5,653. Incredible to think there were 21,173 doing that in 1985.
Finally, this does not mean necessarily a reduction in the number of châteaux. It’s a long story but it’s a consolidation of ownership.
At the last count, there are 8,800 registered wine-producing châteaux. Though I might just check that spreadsheet.
See all of our 376 articles about Bordeaux so far published.