As a follow-up to my Bordeaux 2019 weather and harvest report last autumn, below is an update of the production statistics. These somewhat nerdy articles, shamelessly illustrated with detailed graphs and tables, serve as a backdrop to the en primeur tastings which take place in late March and early April.
The primeurs or futures campaign involves a tiny fraction of the overall production, however, so it can also be useful to understand the bigger picture of Bordeaux – or, indeed, the map. Few people realise just how much wine is made here, so below I show where 2019’s 650 million bottles, or the equivalent, are sourced.
Bordeaux 2019 output compared with recent years
I spend too much time looking at how the vines are coping each season and I predicted in my report at the end of the harvest that the overall 2019 volume would probably be a little less than the 10-year average of 508 million litres (2009–2018) … not far off 2018, up on 2017, down on 2016.
Production in 2019 was actually 486.3 million litres, just short of the 2018 figure of 498.6 million litres (500 million litres then when rounded up).
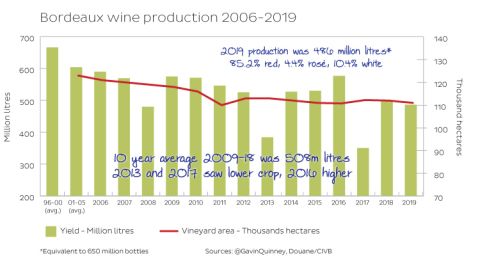
Although 2019 is close to the average total volume, the last decade has seen two low crops in 2013 and 2017, and the 10-year average prior to that – for 2003–2012 – was 566 million litres, albeit with a slightly larger vineyard area. The average area for that decade was 118,000 ha (291,600 acres), versus 113,000 ha (279,200 acres) in the last ten years.
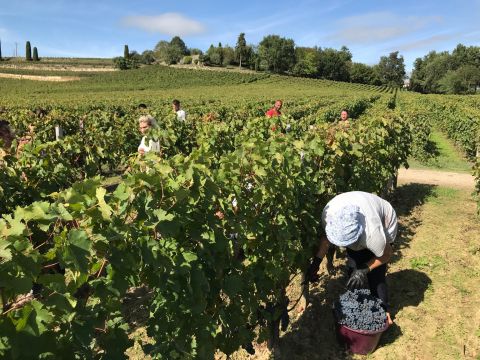
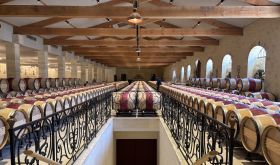
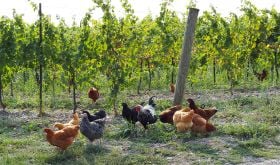
A full 89% of the 110,836 hectares (273,880 acres) of Bordeaux vines in production in 2019 were planted with red varieties, and just 11% with white. Two-thirds of that 89% is Merlot, 22% Cabernet Sauvignon, 9% Cabernet Franc (above, in St-Émilion in 2019), with the last 3% split between Petit Verdot, Malbec and a smidge of Carmenère. The white-wine vineyards are split between Sauvignon Blanc (including a little Sauvignon Gris) and Sémillon with 46% each, with 5% Muscadelle and others.
Just over 85% of the wine produced in 2019 was red, with 4.4% rosé (made from red grapes), 9.2% dry white and a tiny 1.2% sweet white.
Good yields in the top appellations
Although the overall production for 2019 was similar to 2018, there was a significant difference in the output of the leading Bordeaux appellations. The 2019 vintage saw a return to good yields across the board in the seven most prestigious areas, after mixed fortunes in the two previous vintages.

Margaux, Pomerol and Pessac-Léognan enjoyed 2016-type yields (or better) in 2019, after the frost in 2017 and mildew risk in 2018, with St-Émilion not too far behind. St-Julien and St-Estèphe largely escaped any frost damage in 2017, and 2019 continued a run of successful annual yields, with Pauillac having improved production as a whole on the partially mildew-hit 2018.
To put these yields of hl per ha into context, the density of vines is comparatively high in these appellations, with 6,500–10,000 vines per hectare. With a yield of 45 hl/ha, that's a bottle per vine for a vineyard with 6,000 plants per hectare, such as in parts of St-Émilion. That same yield would make two-thirds of a bottle per vine in a more densely planted plot, as in, say, St-Julien on the left bank, with 9,000 vines per hectare (4,500 litres giving 6,000 bottles). Let’s not get started on Sauternes, poor things.
Mixed flowering and summer drought
Outside the more famous appellations, on the other hand, yields were well down on those of 2016. The table makes this clear and shows that, broadly speaking, levels were on a par with 2018, though for different reasons. There was far less of a threat of mildew in 2019 than in 2018 but the all-important flowering in June saw mixed results, with uneven fruit set thanks to rain and chilly weather at just the wrong time for some vineyards. Later, summer drought led to smaller berries and less juice in many areas.
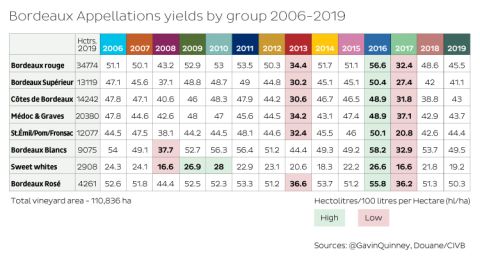
Vineyards are planted with fewer vines per hectare in the more basic appellations on the whole, with 3,000 to 4,000 vines being the norm for basic AOP Bordeaux, and 4,000 to 6,000 in, say, the Côtes de Bordeaux.
Where 650 million bottles come from
The number of hectares in the table above gives a feel for the relative scale of Bordeaux appellations, but here is a chart and a colour-linked map to show where the main areas are, and what they've produced in recent vintages.

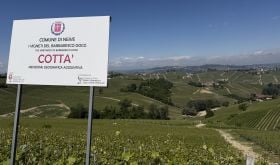
Almost a third of production is straight Bordeaux rouge, with most of this coming from the area between the Garonne and Dordogne rivers, the area known as the Entre-Deux-Mers. The appellation of that name is a white-only appellation.
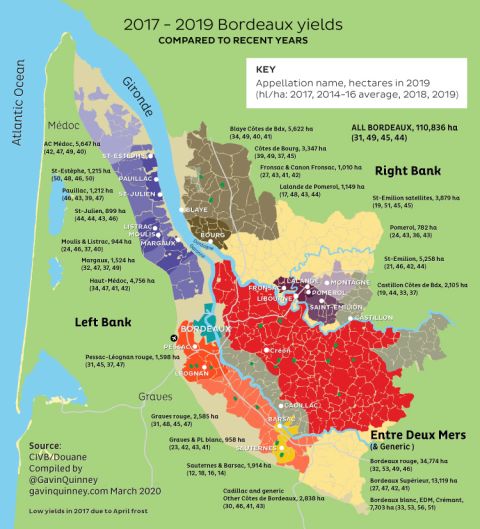
As we've seen, yields in the more-famous Haut-Médoc appellations of St-Estèphe and St-Julien have been consistently good, not least compared with the right bank in 2017.
The green dots are merely representative of where some of the vineyards producing dry white wine are located, though this is far from a complete showing.
Overall then, the 2019 vintage delivered good yields for the top Bordeaux appellations, and fair to decent ones for the rest. Once again, there’s a lot of wine – at all price points – that needs to find a home.
[Those deciding on prices for the 2019 vintage en primeur, please take note – JR]