
We owe nearly 2,000 wine lovers a report on the survey they so kindly responded to in February. We are so grateful to all of them, and especially to the approximately 600 who took the trouble to add a specific comment at the end of the multiple-choice questionnaire – and an amazing 445 of them even said they would be prepared to participate in a focus group discussion about JancisRobinson.com. THANK YOU! (We emailed 36,000 addresses with a link to our survey and I’m told a response rate of over 5% to what is effectively a cold call is pretty good.)
Just over 70% of respondents were members of JancisRobinson.com, but it was also good to get feedback from the just under 30% who are yet to take the plunge.
We asked respondents which elements of this website they found most enjoyable and useful. Perhaps predictably, tasting notes/wine reviews came out top with our exclusive articles not too far behind.
Then came the really interesting/useful bit of the survey. We asked which ‘new features and experiences’ respondents would welcome. Top of the pops was podcasts. Message received and will be acted upon! Although this result rather clashes with the answers to the question about the frequency with which respondents listen to podcasts. The biggest category checked was ‘Rarely or never’, although admittedly 16% said they listened to podcasts ‘Almost every day’.
Then came ‘Virtual events with Jancis (such as a Q&As, or panel discussions with notable wine experts)’ and there was also quite a bit of interest in virtual wine classes.
I was glad to see a relative lack of enthusiasm for a store with JR.com-approved wine accessories and a ‘Wine delivery subscription service’, which is definitely not something I’m keen to get into. Words are what I’m comfortable delivering, not bottles.
Just over 62% said they had participated in a webinar on some subject (not necessarily wine).
The answers to the question ‘How did you hear about us?’ are always especially interesting for those who devise such surveys. The most common answer was ‘I forget’ but 353 respondents cited the Financial Times, with the two next most common being ‘Recommendation from someone in the food and wine industry’ and ‘Word-of-mouth referral’. A mere 4.1% of respondents said they found us via Google, which has fired up our new owners’ SEO specialists.
We asked respondents to specify which other wine websites and publications they subscribed to and Decanter.com was the most popular choice (perhaps reflecting all those British respondents) but we were very gratified to see that ‘Nothing else’ was nearly as popular.
I was also very cheered by the results of respondents’ being asked how likely they were, on a scale of 1 (not) to 10 (very), to recommend JR.com to a friend. A delightful 73% of respondents answered 8, 9 or 10. Hooray!
Then we asked, ‘Has the value you have received from your JancisRobinson.com subscription met or exceeded your expectations?’, again asking for a rating from 1 to 10. A total of 71% of scores were 7 or above with 8 the most common score. And 8 was again the most common score when answering the question ‘How much do JancisRobinson.com wine reviews or tasting notes influence your decisions when selecting wine?’
But these answers were just nice pats on the back. Two really useful questions followed. The first was ‘Would you like to see expanded content on JancisRobinson.com in any of the following areas?’ and, rather to our surprise, this was the ranking of the various topics:
Wine travel and tourism 54.2%
Producer profiles 53.9%
Winemaking and vine-growing 46.4%
Wine and food pairings 45.9%
Sustainable practices and innovations in the wine industry 34%
Book reviews 31.7%
Restaurant reviews 29.9%
Coverage of American wine 18.9%
Wine-related products 17%
None of the above 4.4%
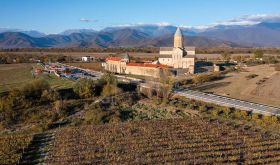
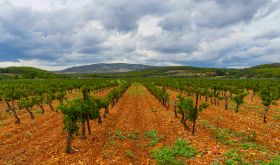
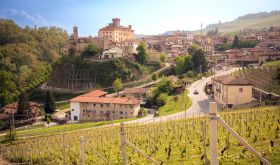
And then, the wine-lovers’ question: ‘Which of these regions or topics are you most interested in or would like expanded coverage of?’
Italy 55.9%
Burgundy 49.7%
Spain 47.1%
Rhône 46%
Bordeaux 40.4%
Portugal 36.2%
Germany 34.9%
New Zealand 29.4%
South Africa 29.4%
Organic/biodynamic 28.3%
Australia 27.7%
California 26.1%
South America 25.1%
Natural wine 16.5%
None of the above 2.5%
So, onwards and upwards. Podcasts and more on Italy beckon…